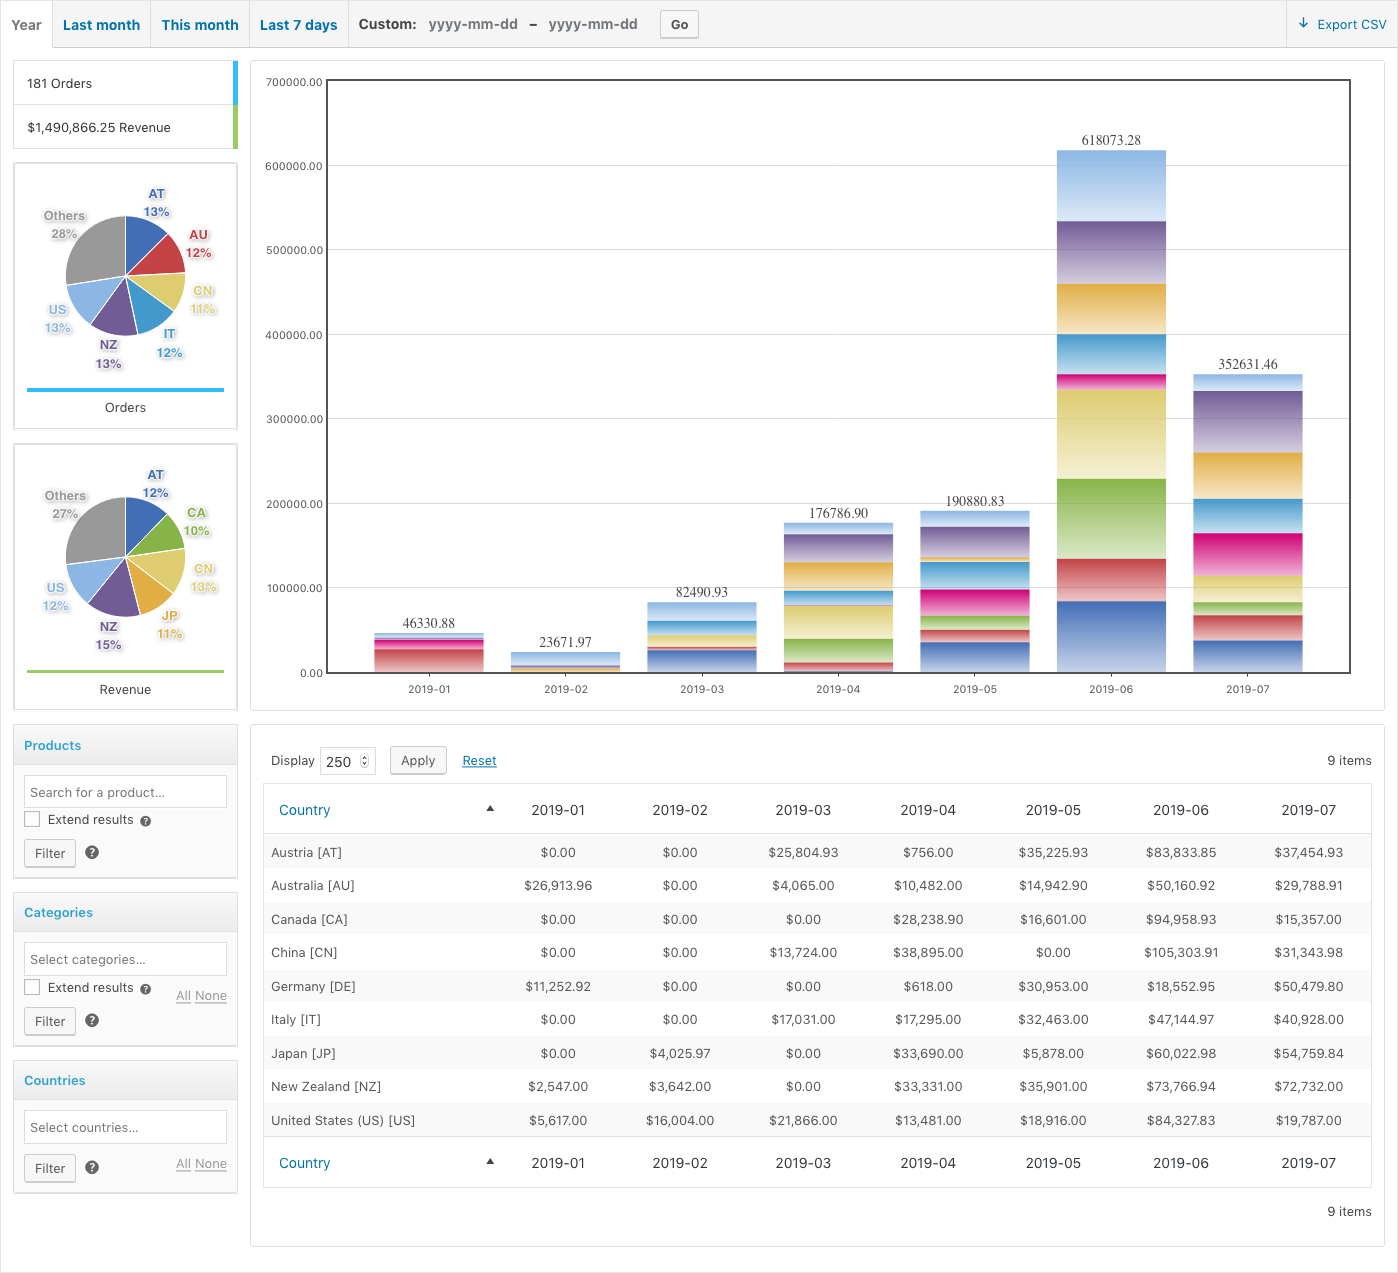
The Revenue Analysis provides a view on the income generated from the sales of your products over time.
Revenue Analysis for the current Year
This report presents a view on the net sales revenue for any chosen time period. It provides the basis for performance comparisons of revenue obtained between different time periods and product segments.
The report helps to provide answers to key questions related to your business:
Is our revenue growing?
Are our marketing campaigns producing the expected increase in revenue?
Where and when have we achieved peak performance?
Which product lines are our main revenue drivers?
What revenue is Product X generating over time?
The analysis of the business revenue provided by this report and the report on Product Revenue allows to identify the items that generate the underlying sales. Management can use this information to outline future marketing strategies based on the direct feedback from customers that is reflected in sales.
The revenue amounts presented are net amounts, i.e. with discounts applied and excluding any tax, shipping and tax on shipping.
↑ Back to top
As with the report on Order Analysis, when no filters are applied, the report includes data from all orders within the considered time period.
Similar to what we have observed for order volumes, where a business usually sees orders that include multiple products, it is interesting to see how key products contribute to the overall revenue.
The Products and Categories filters on this report can be used to limit the data that is included to that which is related to matching products.
If the option to “Extend results” is used on a filter, it is important to note that the figures shown in the main chart and the pie charts of this report, are extended to all products included in orders that contain the selected products or product categories.
As we have seen in the discussion of the Order Analysis report, these filters and options can be combined as desired. The analysis can convey an outlook on product lines that act as revenue drivers.
We can recommend to use this report together with the Product Revenue report, where the revenue figures can be further broken down by product.
↑ Back to top
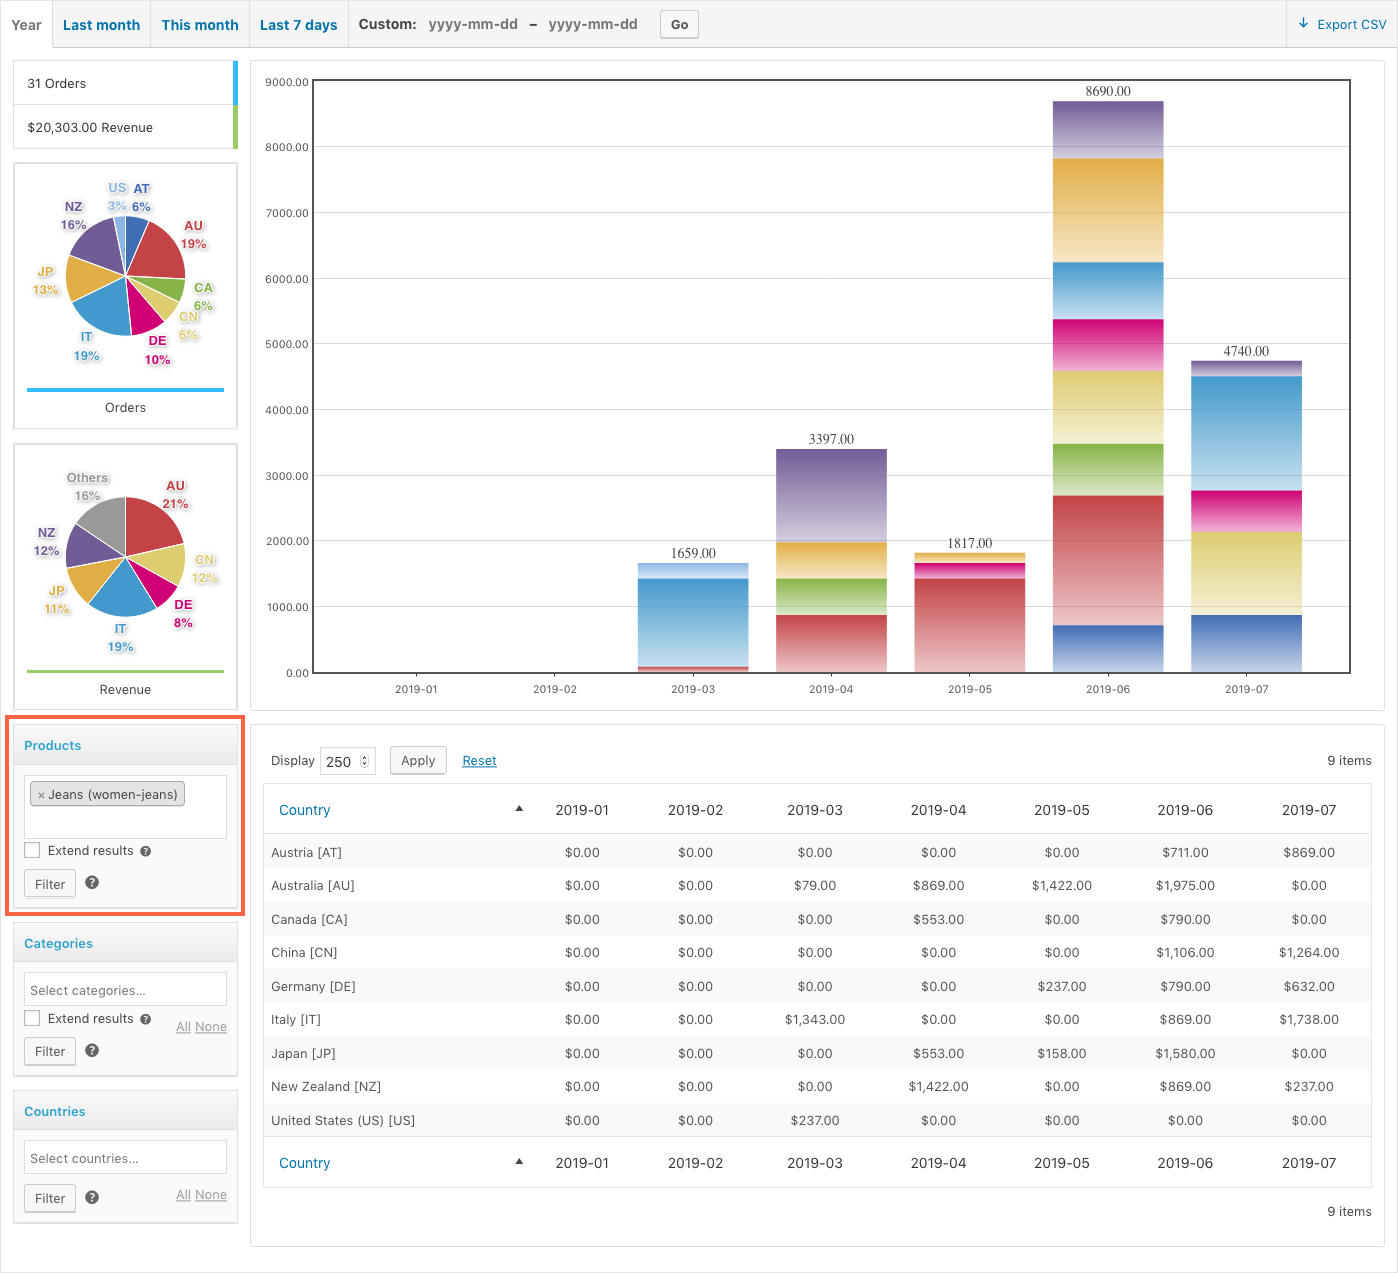
In the following examples, we will analyze revenue from Women’s Jeans (a product) and contrast it with several views on revenue from Dresses (a product category).
Revenue from Jeans – We use the Products filter to restrict the data to Women’s Jeans sold only.
Revenue from Jeans (Product)
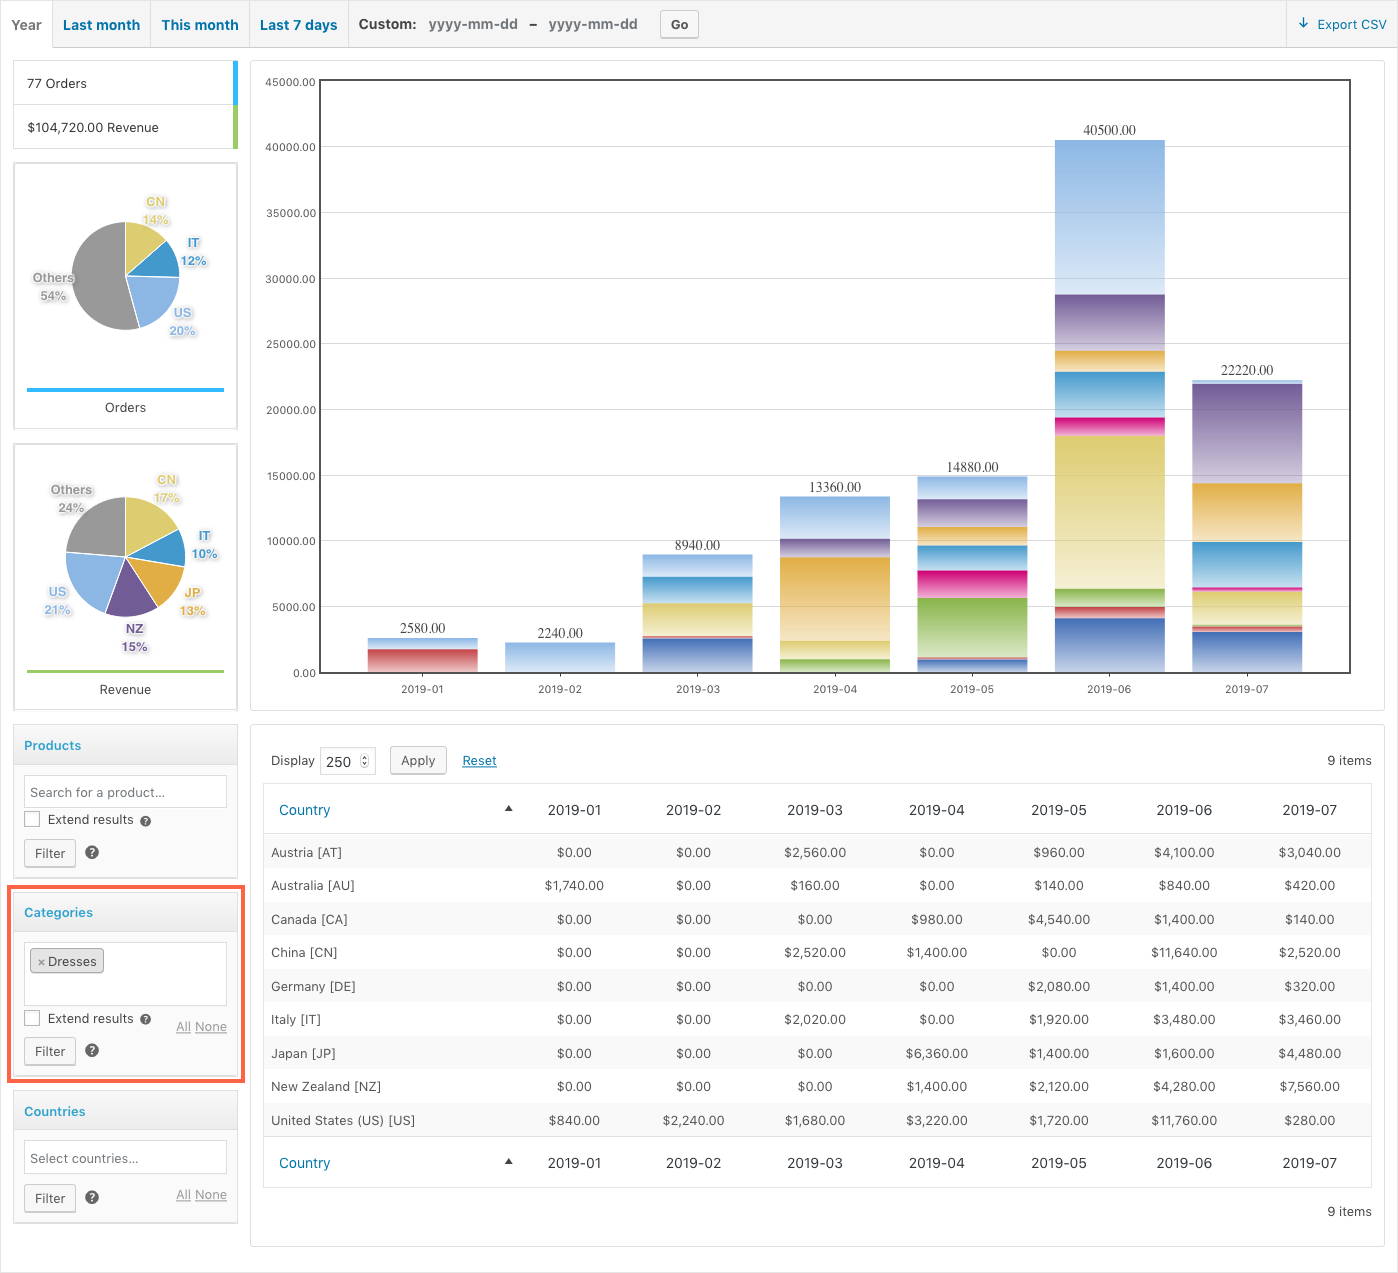
Revenue from Dresses – We use the Categories filter to include only data from Dresses sold.
Revenue from Dresses (Product Category)
↑ Back to top
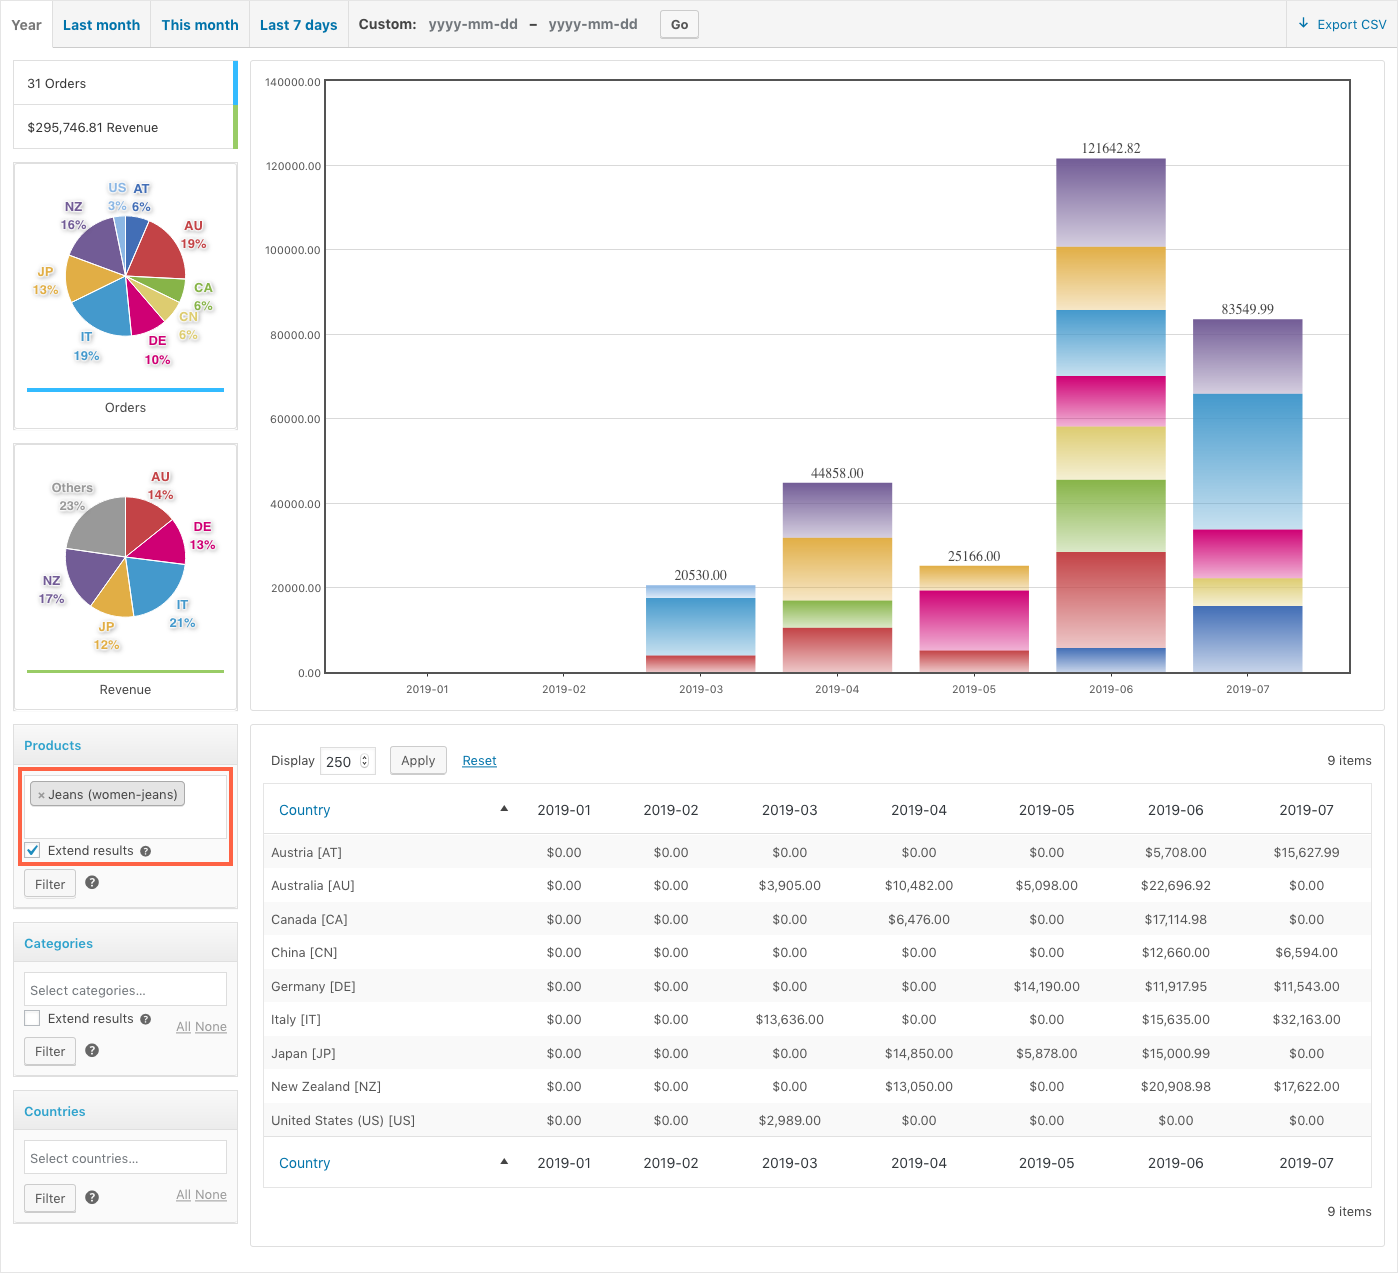
Total revenue from orders that contain Jeans – Using the “Extend result” option on the Products filter, we obtain a report on the total revenue from orders that contain Jeans. The figures include revenue from all products sold in the corresponding orders.
Revenue from Orders with Jeans – Figures extend to all products of these orders
Revenue from Dresses sold together with Jeans – Based on the previous report, we also apply the Categories filter to restrict the numbers to revenue from Dresses. The combination yields the revenue obtained from Dresses that were sold together with Jeans.
Revenue from Dresses sold together with Jeans
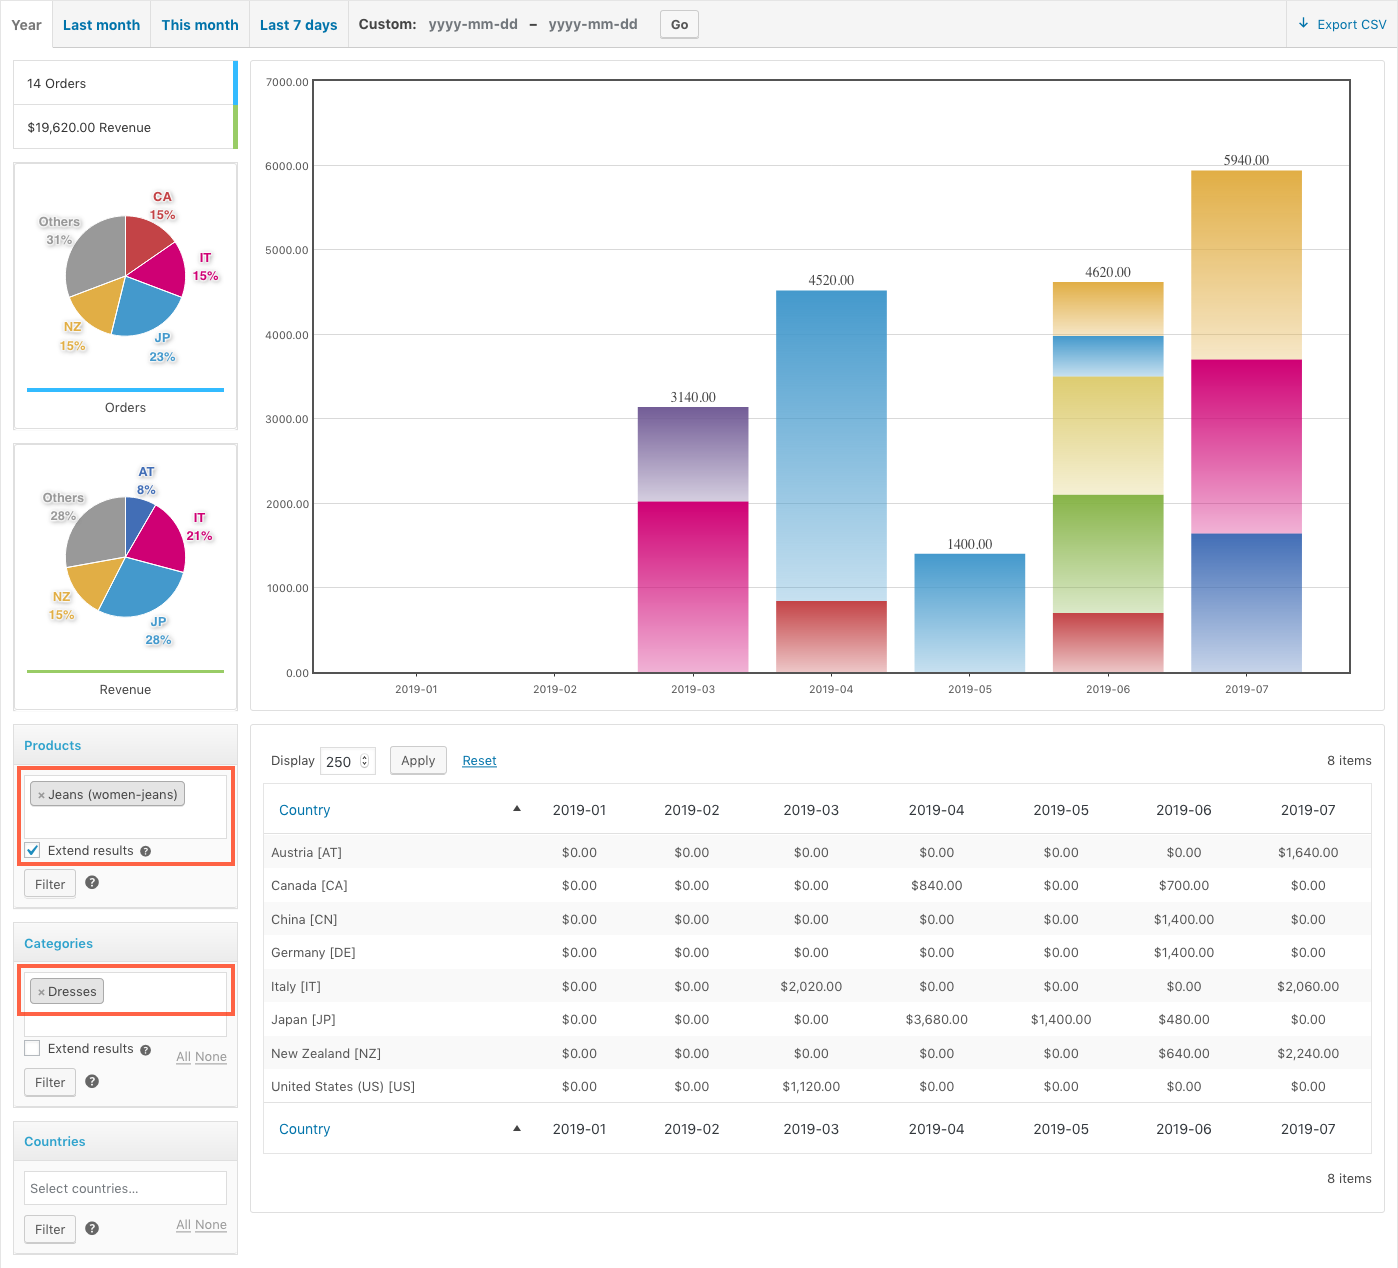
Revenue from Jeans sold together with Dresses – Here we use the “Extend results” option on the Categories filter instead of the Products filter from the previous report. The result is that we obtain the revenue from Jeans sold together with Dresses.
Revenue from Jeans sold with Dresses