The Order Analysis shows the trend for order volume over time. This report helps to understand whether the number of orders placed by customers is increasing or decreasing. As its focus is on order volume, it provides a more general quantitative approach to viewing business performance. The report provides a visually intuitive representation of how the business is doing over time.
- Is our business volume growing?
- Are our marketing campaigns effective?
- Is our order volume correlated to our net revenue?
- How many orders do we get for Product X over time?
 The Order Analysis report is similar to the Revenue Analysis, but it focuses on the number of orders instead of the revenue over time. Used together, these reports help to understand the relation between the order volume and the corresponding revenue.
These reports allow management to discover regions of growth, stability or decline, based on order volume. The data presented should ideally be contrasted against related information, including significant events that occurred during, or which have affected, the time period considered for the report, as well as qualitative and quantitative factors that can be correlated.
The Order Analysis report is similar to the Revenue Analysis, but it focuses on the number of orders instead of the revenue over time. Used together, these reports help to understand the relation between the order volume and the corresponding revenue.
These reports allow management to discover regions of growth, stability or decline, based on order volume. The data presented should ideally be contrasted against related information, including significant events that occurred during, or which have affected, the time period considered for the report, as well as qualitative and quantitative factors that can be correlated.
Report Features
↑ Back to top Main Chart (1)
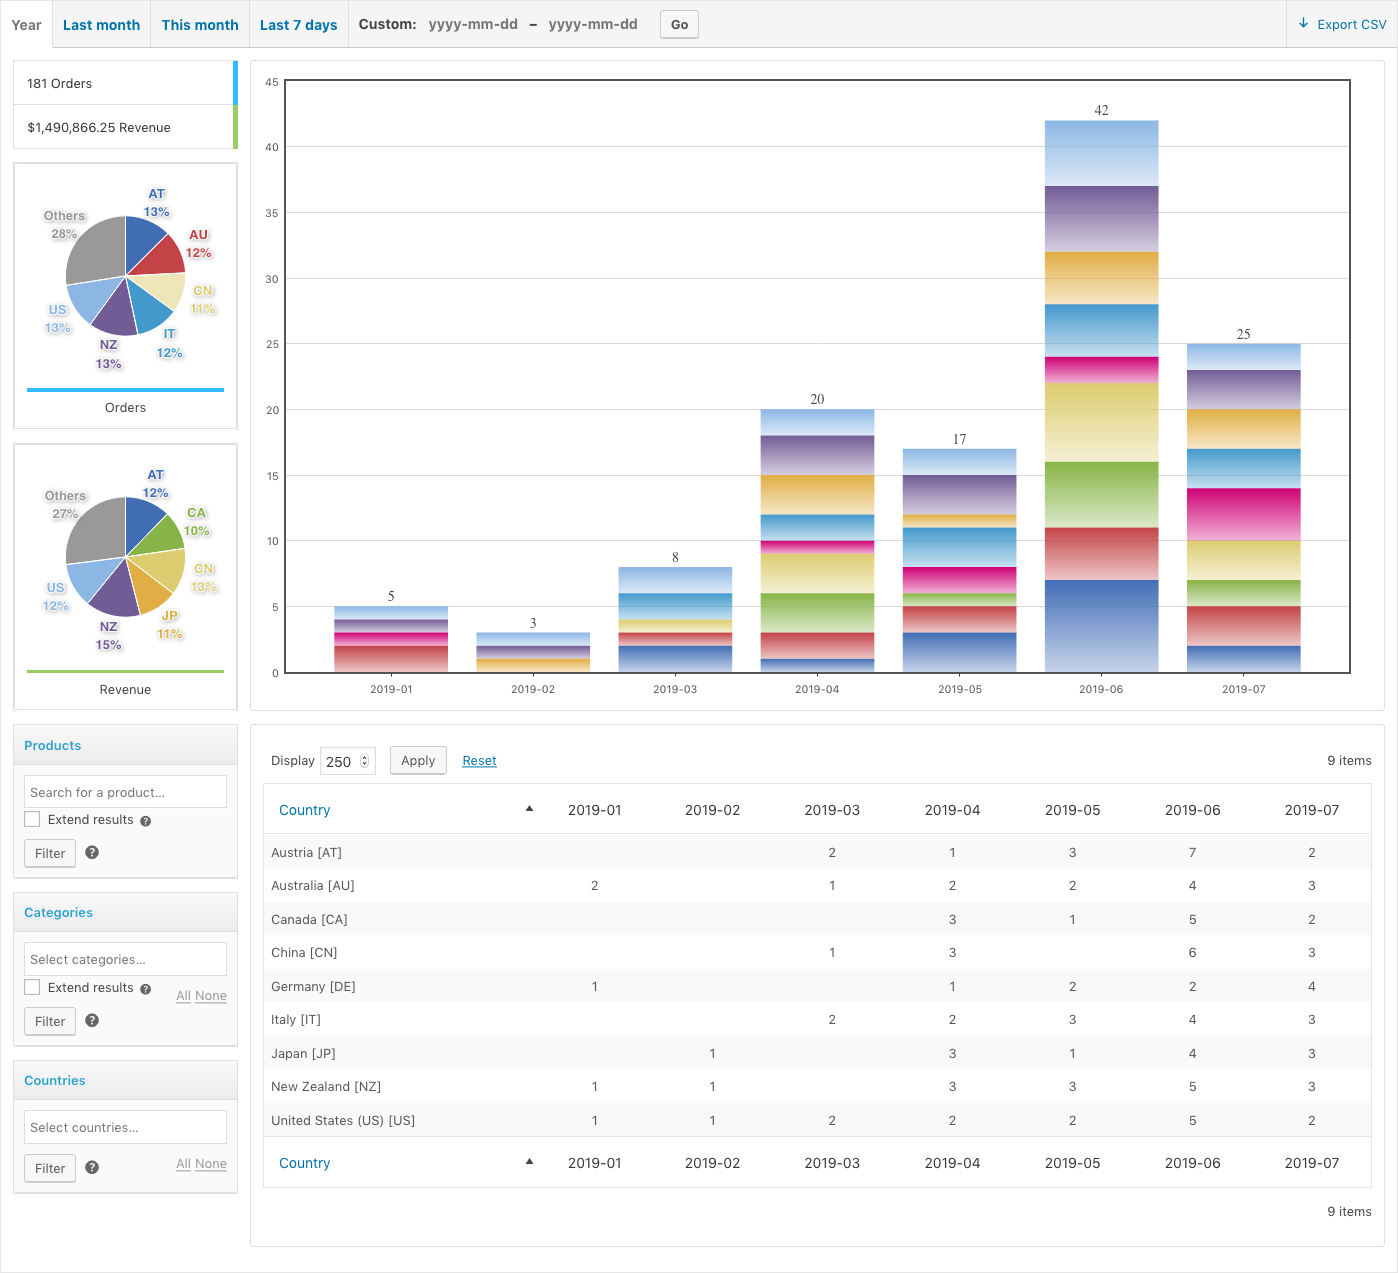
The main chart of the Order Analysis report presents order volumes over time using stacked bars. Each bar segment corresponds to the number of orders from a country for the time slice covered by the bar.
Data Table (2)
The table shows the number of orders over the date range of the report. Numbers are given per day, month or year, depending on the extension of the time period considered. You will find one row per country. Each column finds its equivalent in one stacked bar on the main chart, where each colored bar segment corresponds to an entry in the table.
Key Statistics (3)
The report includes overall sums for the number of orders and total net revenue. The numbers will vary accordingly when the report’s filters are used.
Orders Pie Chart (4)
Each segment in the chart represents the total order volume per country. The most prominent entries are shown as one segment each. Entries that represent minor percentages are summarized in a single segment. The distribution and number will vary accordingly when the report’s filters are applied.
Revenue Pie Chart (5)
The pie chart shows the total revenue per country. Major entries are shown as one segment each while minor ones are summarized in a single segment.
The figures represent net order revenues for all products included in the orders for the time period considered. If the report’s filters are used, the figures exclusively reflect net revenue for matching products.
Products Filter (6)
This filter allows to select one or more products so that the data in the report is for those products only. If products are chosen here, the report will show statistics for orders that have been placed for those products only.
The option to “Extend results” allows to obtain data based on orders that contain the chosen products, but also include the data for all other products included in those orders.
For example, if one product is chosen, the report will present statistics for only that product. The number of orders reflects those orders which include the chosen product. The revenue corresponds to that obtained for the selected product only. If the option to extend results is enabled, the revenue will also include that obtained for any other products in the related orders.
Product Categories Filter (7)
This filter allows to select one or more product categories, restricting the data included in the report to only those products that belong to the chosen categories. This filter also allows to “Extend results” to other products included in matching orders.
Countries Filter (8)
The country filter allows to limit the report to orders from the specified countries. The billing data for orders applies.
Combined Filters and Bought Together Products
The Products (6) and Categories (7) filters on this report limit the orders that are included to those that contain matching products. They can be used in combination to narrow the report down to the desired set of product lines or products.
It can also be used to analyze correlations between products sold:
a) Obtain statistics on products sold together by selecting one or more products in the Products (6) filter and use its option to extend results.
b) Apply the same as in a) and use the Categories (7) filter to limit the products to one or more categories.
Export CSV (9)
The export function provides a text file with comma-separated values of the Data Table, one line per table row. The file obtained is suitable for further processing via spreadsheet applications.
Main Chart (1)
The main chart of the Order Analysis report presents order volumes over time using stacked bars. Each bar segment corresponds to the number of orders from a country for the time slice covered by the bar.
Data Table (2)
The table shows the number of orders over the date range of the report. Numbers are given per day, month or year, depending on the extension of the time period considered. You will find one row per country. Each column finds its equivalent in one stacked bar on the main chart, where each colored bar segment corresponds to an entry in the table.
Key Statistics (3)
The report includes overall sums for the number of orders and total net revenue. The numbers will vary accordingly when the report’s filters are used.
Orders Pie Chart (4)
Each segment in the chart represents the total order volume per country. The most prominent entries are shown as one segment each. Entries that represent minor percentages are summarized in a single segment. The distribution and number will vary accordingly when the report’s filters are applied.
Revenue Pie Chart (5)
The pie chart shows the total revenue per country. Major entries are shown as one segment each while minor ones are summarized in a single segment.
The figures represent net order revenues for all products included in the orders for the time period considered. If the report’s filters are used, the figures exclusively reflect net revenue for matching products.
Products Filter (6)
This filter allows to select one or more products so that the data in the report is for those products only. If products are chosen here, the report will show statistics for orders that have been placed for those products only.
The option to “Extend results” allows to obtain data based on orders that contain the chosen products, but also include the data for all other products included in those orders.
For example, if one product is chosen, the report will present statistics for only that product. The number of orders reflects those orders which include the chosen product. The revenue corresponds to that obtained for the selected product only. If the option to extend results is enabled, the revenue will also include that obtained for any other products in the related orders.
Product Categories Filter (7)
This filter allows to select one or more product categories, restricting the data included in the report to only those products that belong to the chosen categories. This filter also allows to “Extend results” to other products included in matching orders.
Countries Filter (8)
The country filter allows to limit the report to orders from the specified countries. The billing data for orders applies.
Combined Filters and Bought Together Products
The Products (6) and Categories (7) filters on this report limit the orders that are included to those that contain matching products. They can be used in combination to narrow the report down to the desired set of product lines or products.
It can also be used to analyze correlations between products sold:
a) Obtain statistics on products sold together by selecting one or more products in the Products (6) filter and use its option to extend results.
b) Apply the same as in a) and use the Categories (7) filter to limit the products to one or more categories.
Export CSV (9)
The export function provides a text file with comma-separated values of the Data Table, one line per table row. The file obtained is suitable for further processing via spreadsheet applications.