With the release of WooCommerce 4.0 in March 2020, the WooCommerce Reports administration screen is deprecated and won’t receive further updates. For more advanced Subscription Reporting, a tool like Metorik can be used.
Woo Subscriptions adds a subscription Reports section to the WooCommerce Reports administration screen. Reports in this section provide a number of insights about your subscription store that cannot be easily found in other sources.
This guide provides an overview of the Subscriptions Reports feature. It is intended to provide store managers with non-technical details about reports, details how the report derives insight, and why the report is useful.
Viewing Reports
↑ Back to topTo view the Subscriptions Reports:
- Go to WooCommerce > Reports.
- Click the Subscriptions tab.
- Click the name of the report you wish to view from the list.
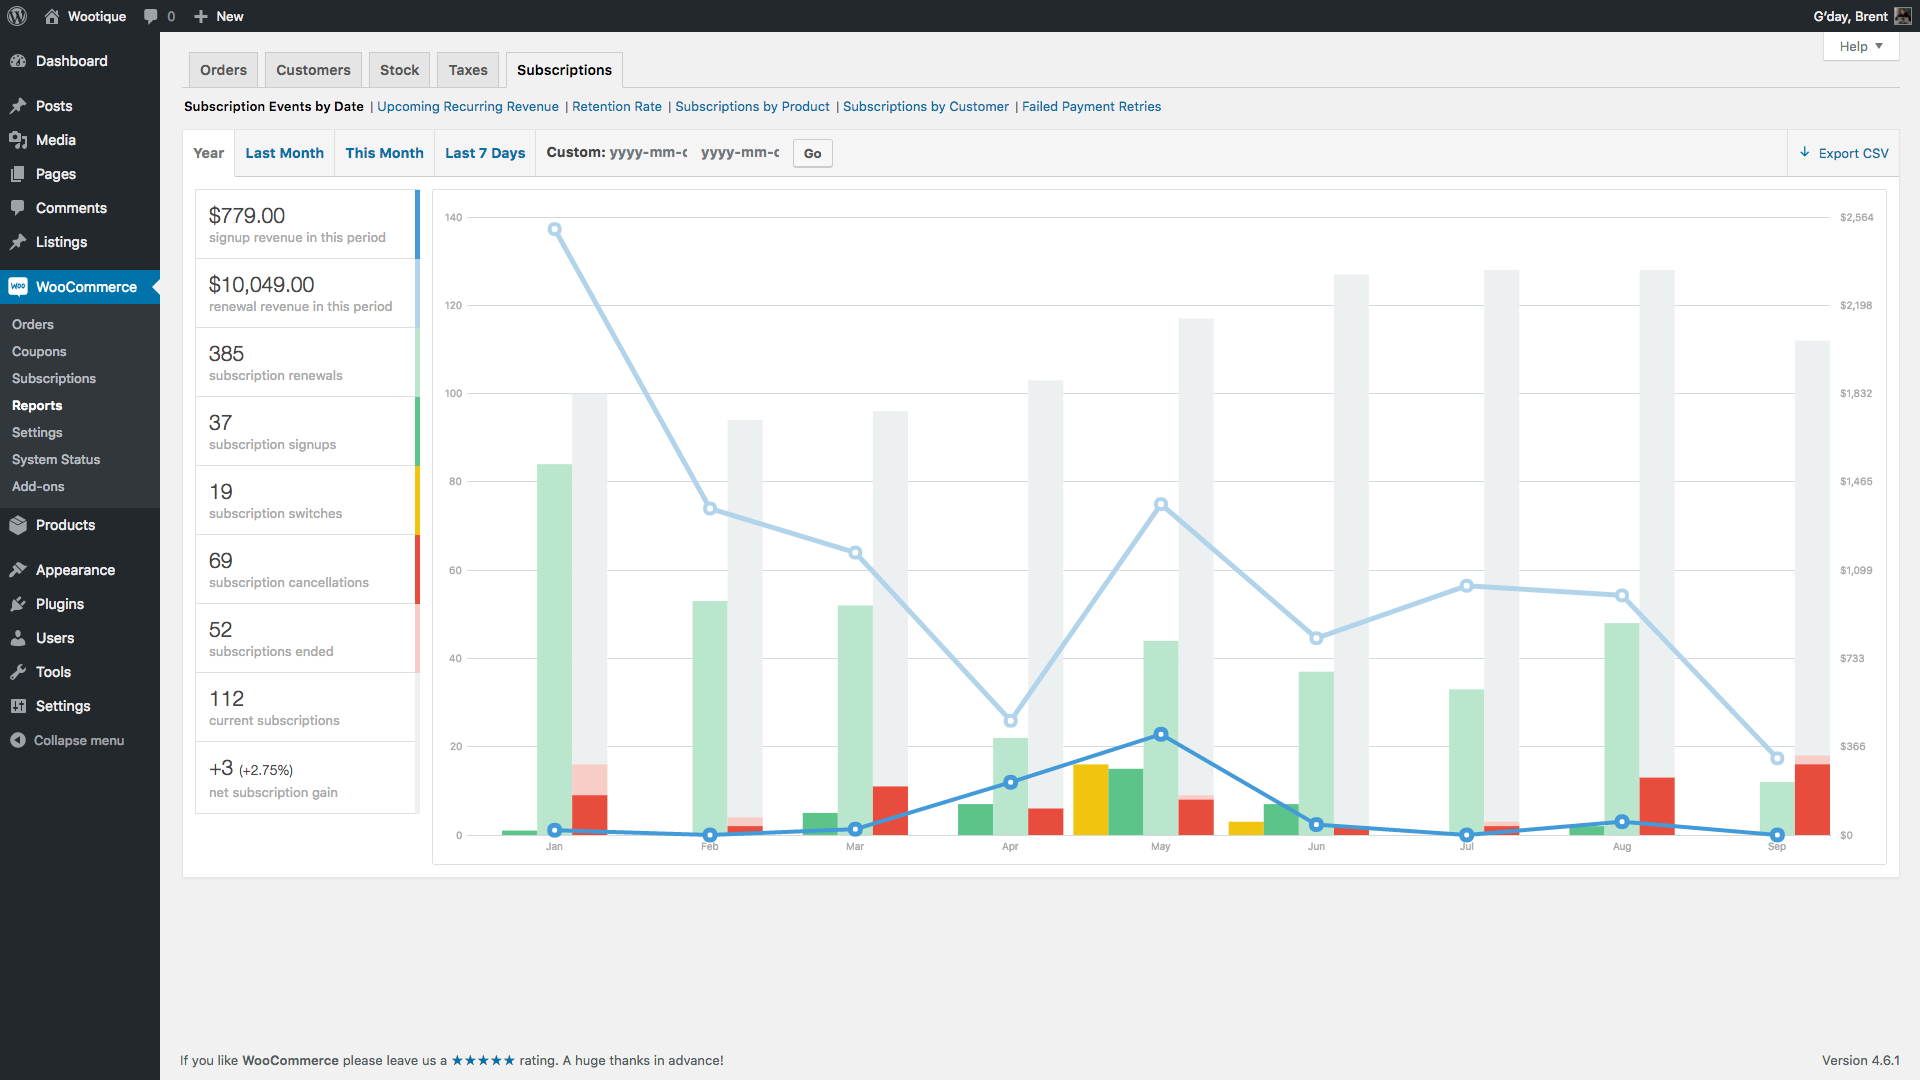
Subscription Events by Date Report
↑ Back to topThe Subscription Events by Date report displays aggregated data for the most important events that occur during the lifecycle of your subscriptions, like sign-ups, renewals and cancellations. This data can be displayed over a number of predefined durations, like current year, current month, last month or last 7 days. They can also be displayed over a custom date range.
The following data is displayed in the Subscription Events by Date report:
- Sign-up Revenue: the total value for orders placed to purchase subscription products during the period (subscription parent orders). The order totals can include sign-up fees, recurring amounts charged at sign-up, as well as amounts for other items, fees, taxes and shipping. Only orders with a paid status, like processing, completed or on-hold, are taken into account.
- Renewal Revenue: the total value of automatic or manual renewal orders created for subscriptions. The order totals can include fees, taxes and shipping. Only orders with a paid status, like processing, completed or on-hold, are taken into account.
- Resubscribe Revenue: the total value for orders placed to resubscribe to existing subscriptions during the period. The order totals can include other items, fees, taxes and shipping. Only orders with a paid status, like processing, completed or on-hold, are taken into account.
- New Subscription: the number of new subscriptions created during this period, either by being manually created by a store manager, bulk imported or a customer placing an order via the store.
- Subscription Signups: the number of new subscriptions created during this period by customers placing an order in the store, which now have a paid order status. This does not include subscriptions manually created by a store manager.
- Subscription Resubscribes: the number of resubscribe orders created during this period by customers placing an order in the store, which now have a paid order status.
- Subscription Renewals: the number of automatic or manual renewal orders created for a subscription with a paid status, like processing, completed or on-hold.
- Subscription Switches: the number of upgrade, downgrade or cross-grade events recorded by a customer placing an order in the store. Only orders with a paid order status are taken into account.
- Subscription Cancellations: the number of subscriptions cancelled by the customer or store manager. The subscriptions may not have actually ended yet, as the pre-paid term may continue into the future, which is why the cancellation count may differ to the ended count.
- Subscription Ended: the number of subscriptions which have either the expired or cancelled status.
- Current Subscriptions: the number of subscriptions that have not ended for the given period. This is all subscriptions with an end date after the current period’s date and a status other than pending or trashed. For example, if a chart shows 3 periods: January 1st, 2nd and 3rd, and the store has 10 subscriptions on the 1st of January with status of active, then 5 of those end on the 3rd of January, there will be 10 Current Subscriptions on the 1st and 2nd January and 5 on the 3rd of January. The number shown in the report’s legend is the total at the end of the chart’s period.
- Net Gain/Loss: the difference between the unended subscriptions at the start and end of a given period. This provides a measure for your store’s churn.
This report makes it possible to review historical trends across many different metrics for the subscription component of the store.
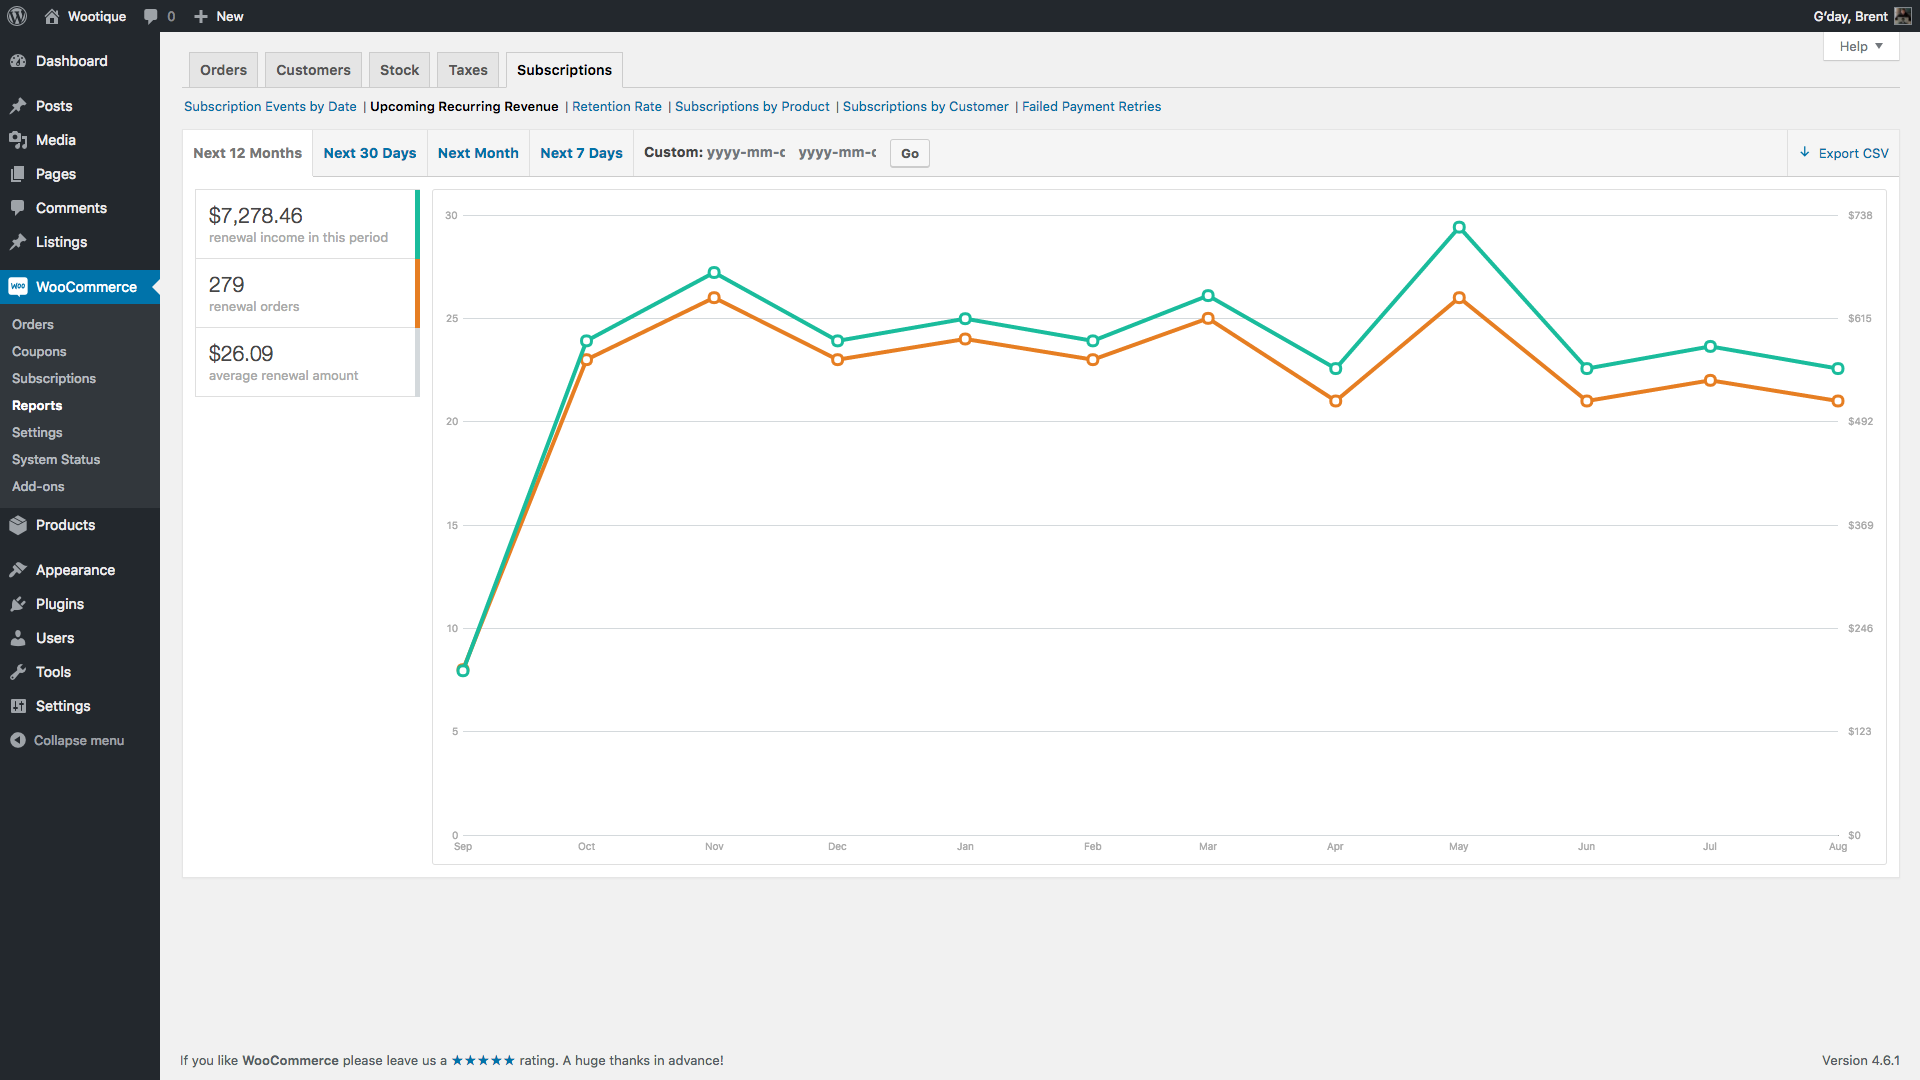
Upcoming Recurring Revenue Report
↑ Back to topThe Upcoming Recurring Revenue report provides a basic forecast for your subscription revenue.
The report determines the number of renewal events that will occur during a given period of time in the future. It does this by looking at the next payment date, billing period and interval for each of your active subscriptions and determining how many payments will occur before the end of the report’s duration, or the subscription’s end date, whichever comes first.
It’s important to note that:
- only currently active subscriptions are used in these calculations, no attempt is made to forecast new sign-ups based on the store’s growth rate;
- the calculations assume all scheduled future payments will be processed without failure; and
- the calculations assume that the subscription will not be cancelled or suspended to prevent any scheduled payments being processed.
For these reasons, the upcoming recurring revenue forecasts should be treated as a guide only and not used as the basis for important business decisions.
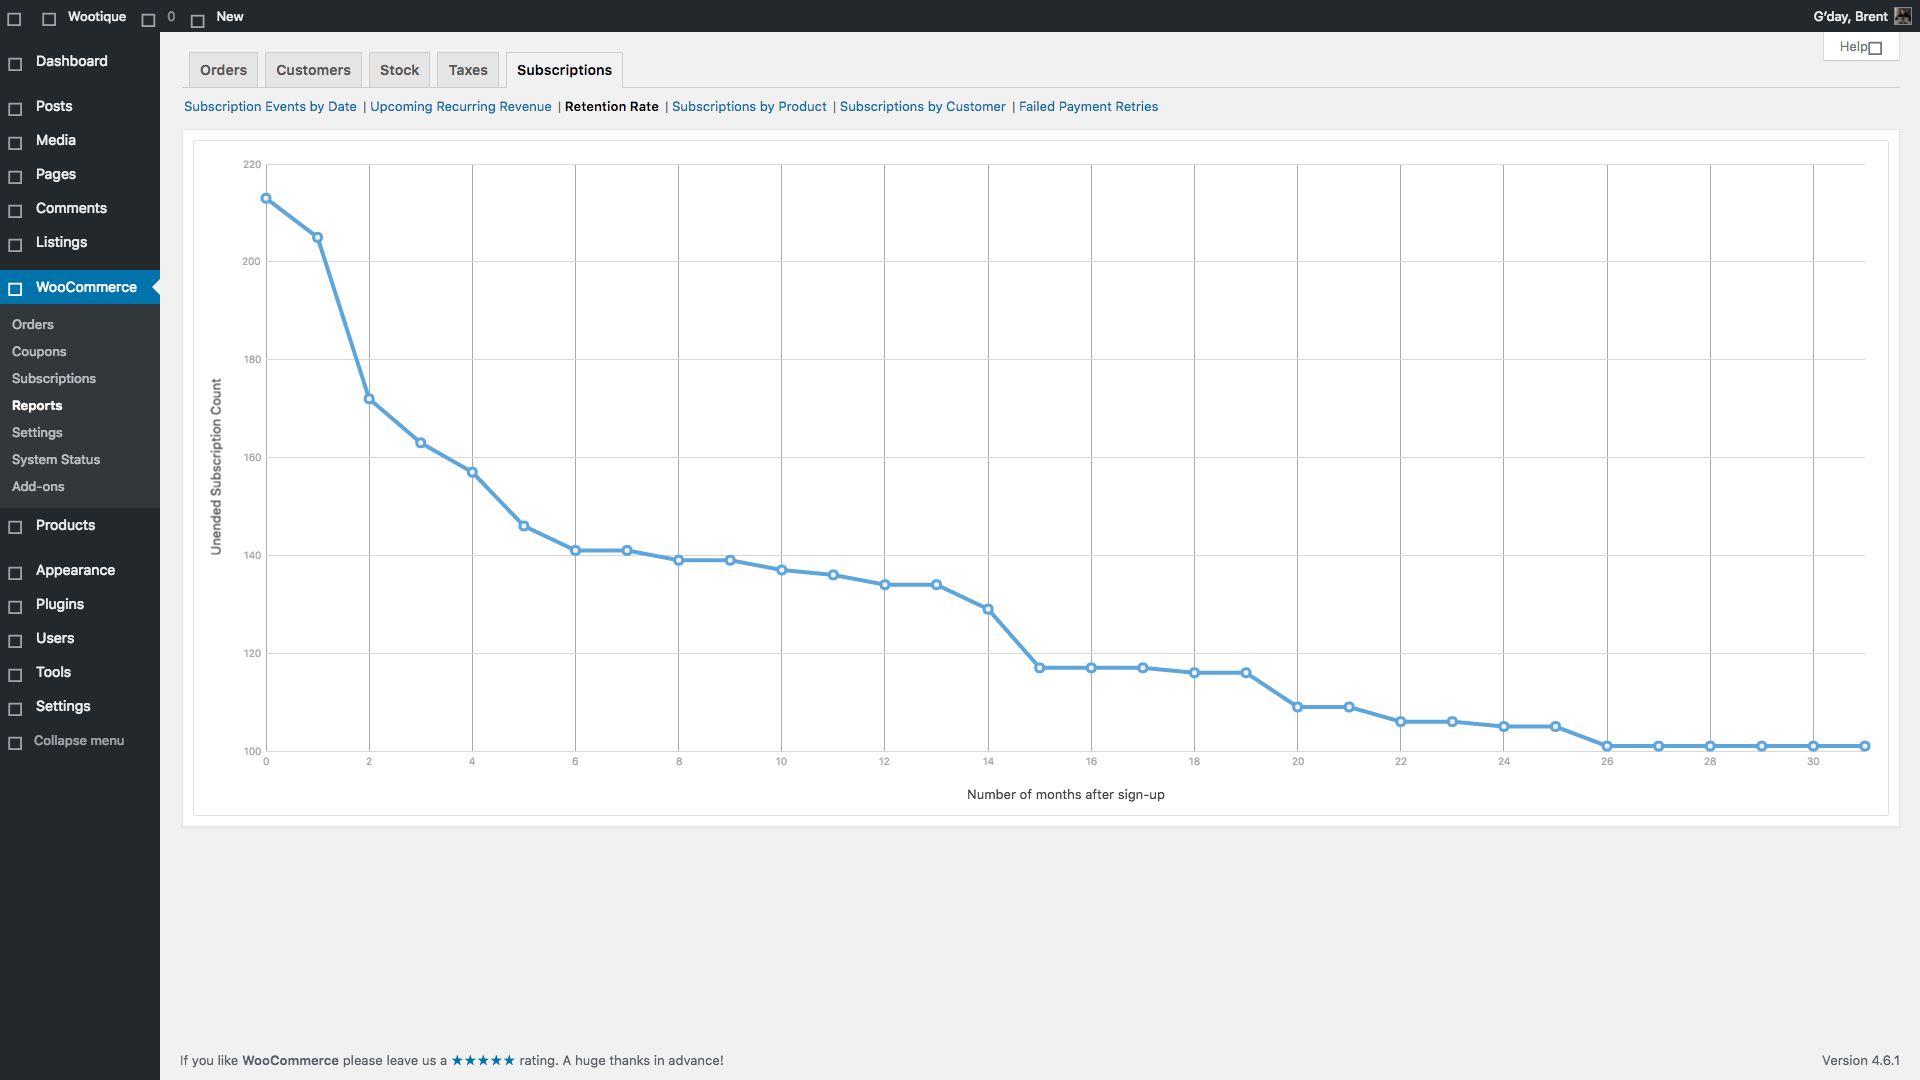
Retention Rate Report
↑ Back to topRetention is the foundation of growth; without keeping your existing users, you’re always filling a leaky bucket.
The Subscription Events by Date report displays churn over time. However, it does not provide any insight into the average length of your subscriptions.
The Retention Rate report fills this gap by displaying the current lifespan for the subscriptions in your store.
This report is very helpful for revealing hotspots for churn. For example, you may see a large drop after 6 months. Identifying these churn hotspots makes it possible to proactively address them. For example, an email could be sent during the 5th month before that 6 month drop to open a conversation with subscribers before they decide to cancel.
Unlike other Subscription reports, the Retention Rate report does not provide a way to customise the timespan. Instead, it will always use the entire lifetime of all subscriptions in your store.
Subscription Lifespan
↑ Back to topThe lifespan for a subscription is the total time between when it is first created and when it ends, either by cancellation or expiration. Subscriptions doesn’t take into consideration how long the subscription is active or on-hold during these two points. It does not record that data.
For example, a subscription that is created on 1st January 2016 and expires on 1st January 2017 has a lifespan of 12 months, regardless of whether it is on-hold for some of those months.
The lifespan also accounts for how the subscription ended. If the subscription was canceled, the cancellation date is used as the end of its lifespan. This is usually before the subscription’s actual end date, but it is a more accurate representation of retention, as it indicates when the customer decided to end the subscription, not when the prepaid term came to an end.
For example, an annual subscription created on 1st January 2016 and cancelled on 2nd July has a lifespan of 6 months, even though the end date is 1st January 2017, the end of the prepaid term.
Retention Period for X-Axis
↑ Back to topThe period used to plot the lifespan of your subscriptions on the x-axis depends on the length of the longest subscription lifespan in your store.
If any subscription in your store has a lifespan over one year, the chart will plot retention by month. If a subscription has a lifespan of more than 6 months but not more than a year, it will plot it using weeks, otherwise, it will use days.
Unended Base Point
↑ Back to topThe Retention Rate chart uses the number of subscriptions that have not yet ended as the base point for the y-axis, rather than a 0 base. This helps to exaggerate changes in the chart.
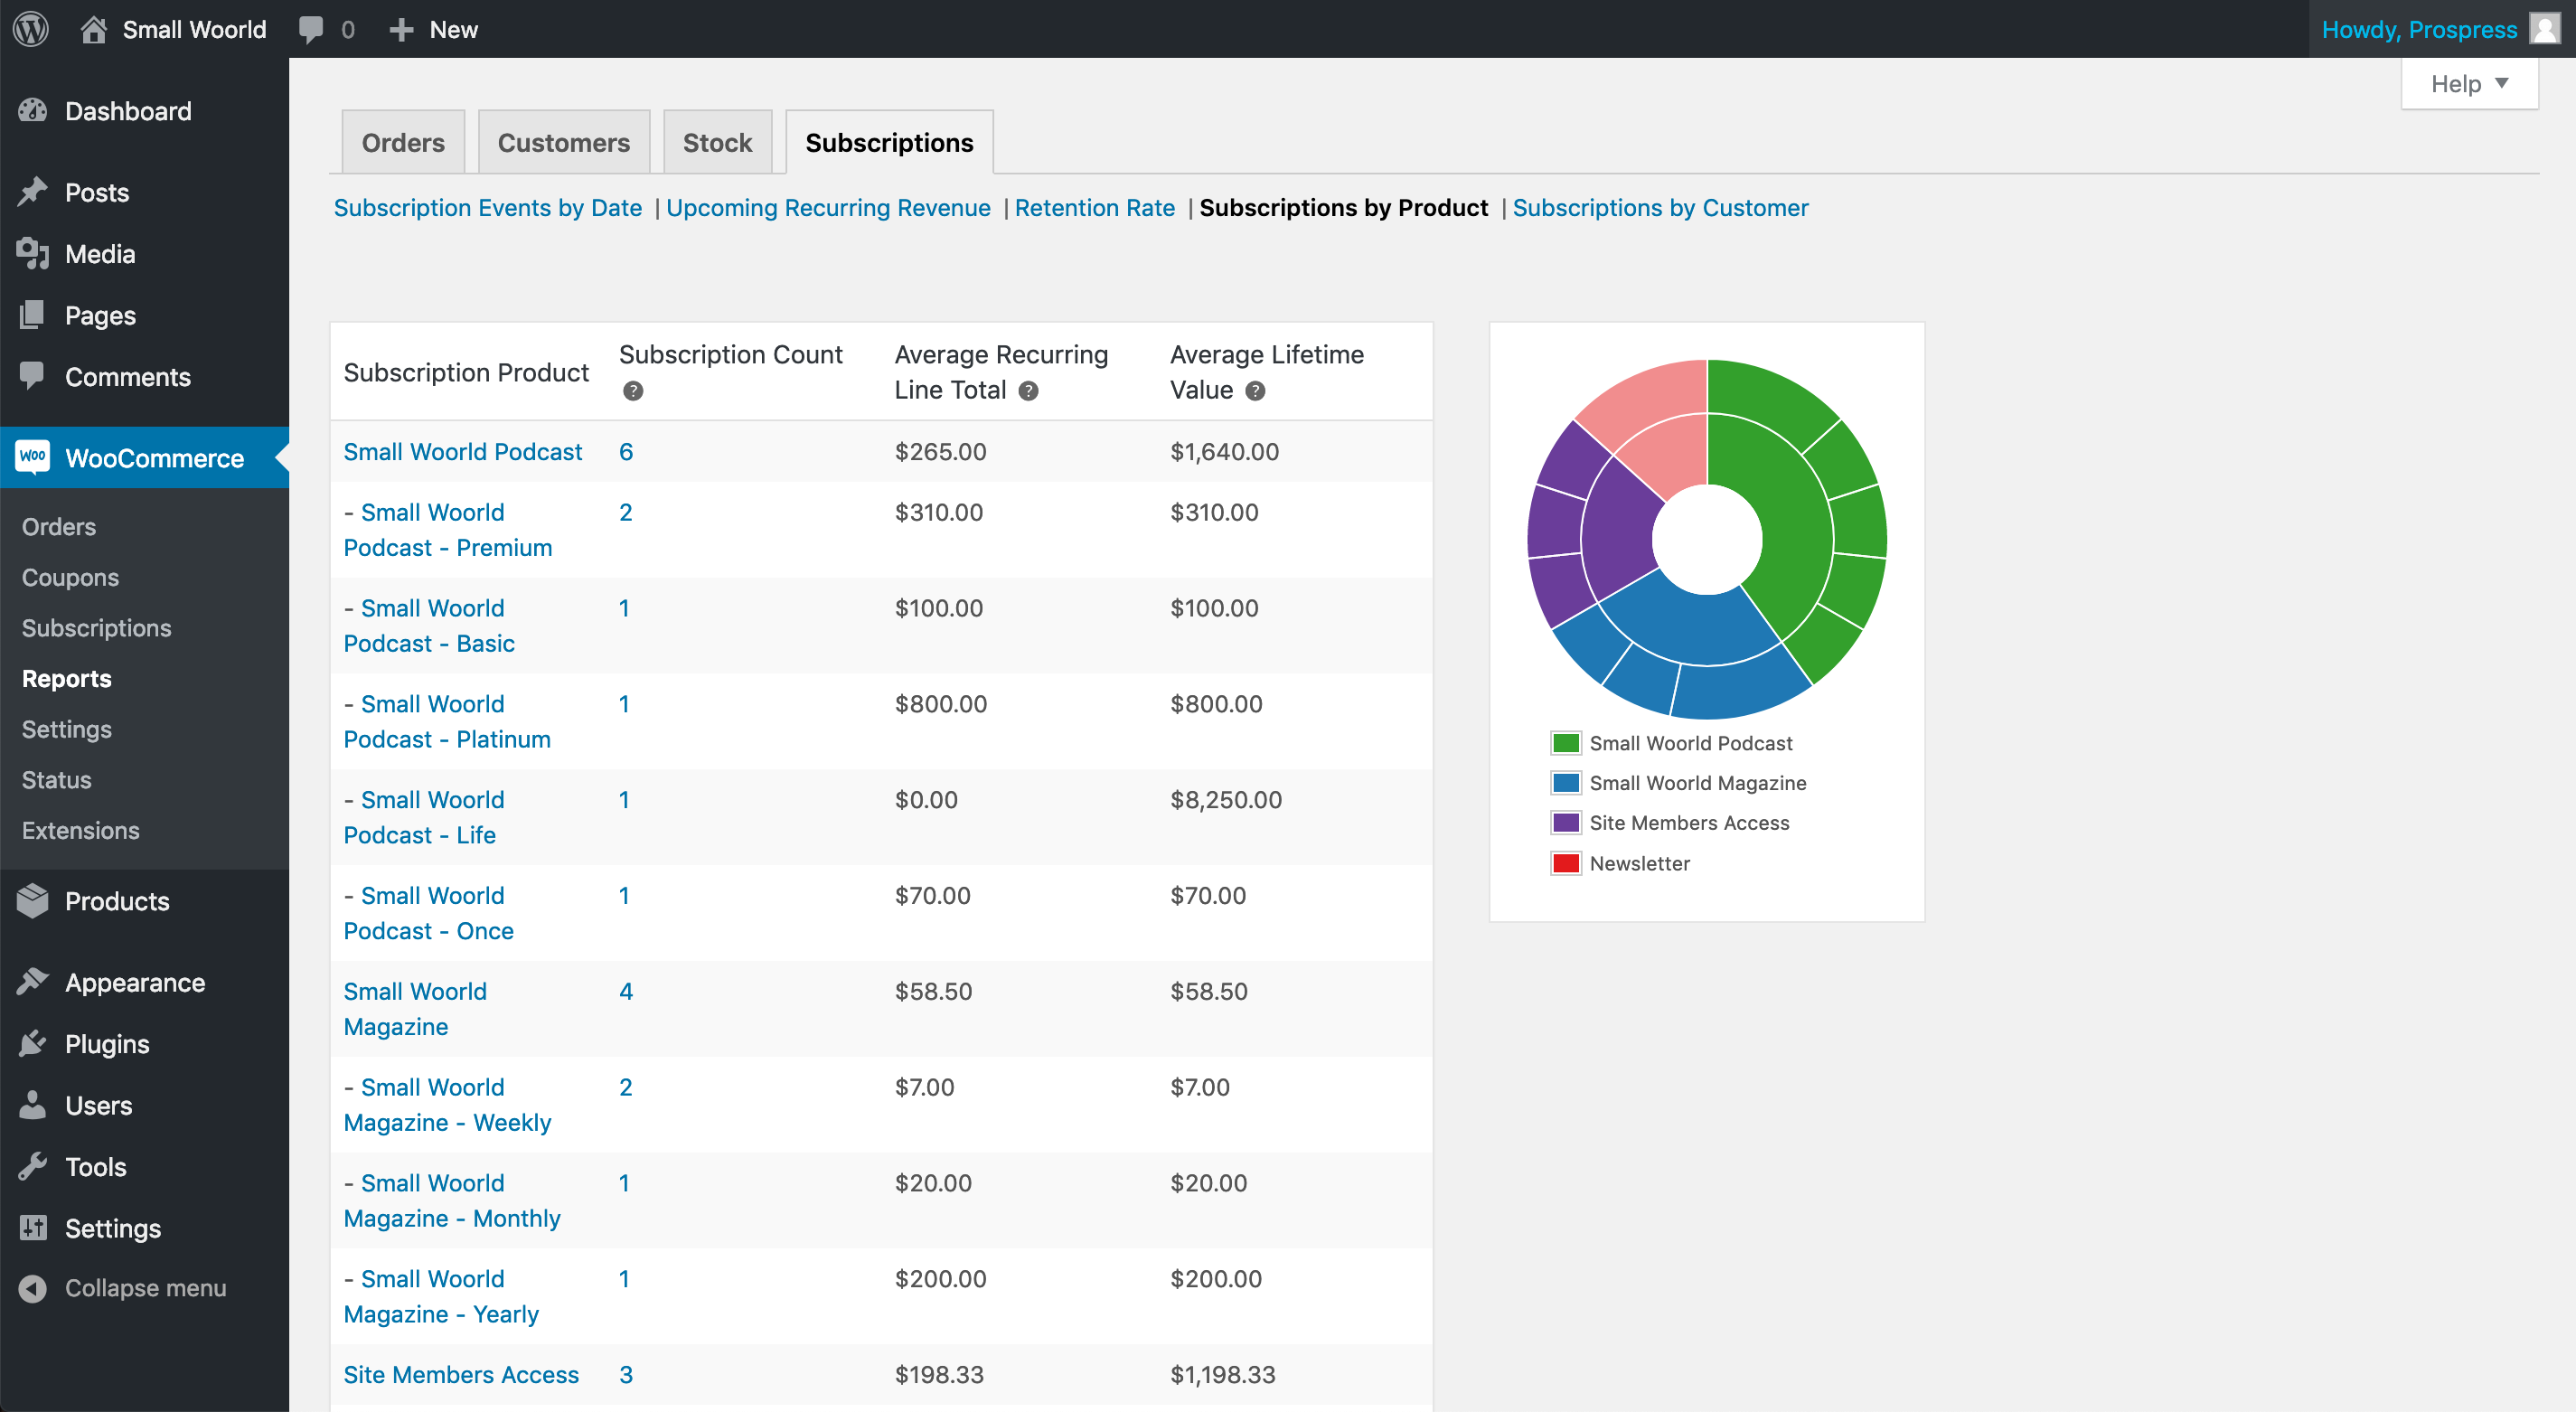
Subscriptions by Product Report
↑ Back to topThe Subscriptions by Product report provides an overview of the popularity and revenue for your subscription products and subscription product variations. Specifically, this report details:
- Subscription Counts by Product: Number of subscriptions that include this product as a line item and have a status other than pending or trashed.
- Average Recurring Line Total by Product: Average line total for this product on each subscription.
- Average Lifetime Value for each Product: Average line total for this product line item across subscription orders. This is determined by combining the line total for this product on both renewal and initial orders then dividing by the total number of non-pending subscriptions for that product.
Revenue from subscription products is based on the line total for each product on each order: both sign-up orders and renewal orders. It does not include shipping, fees or other amounts recorded in order totals.
Subscription product variations are also included in the ‘Subscription Product’ column. Variations can be identified by a leading hyphen and will be located directly below the corresponding parent product.
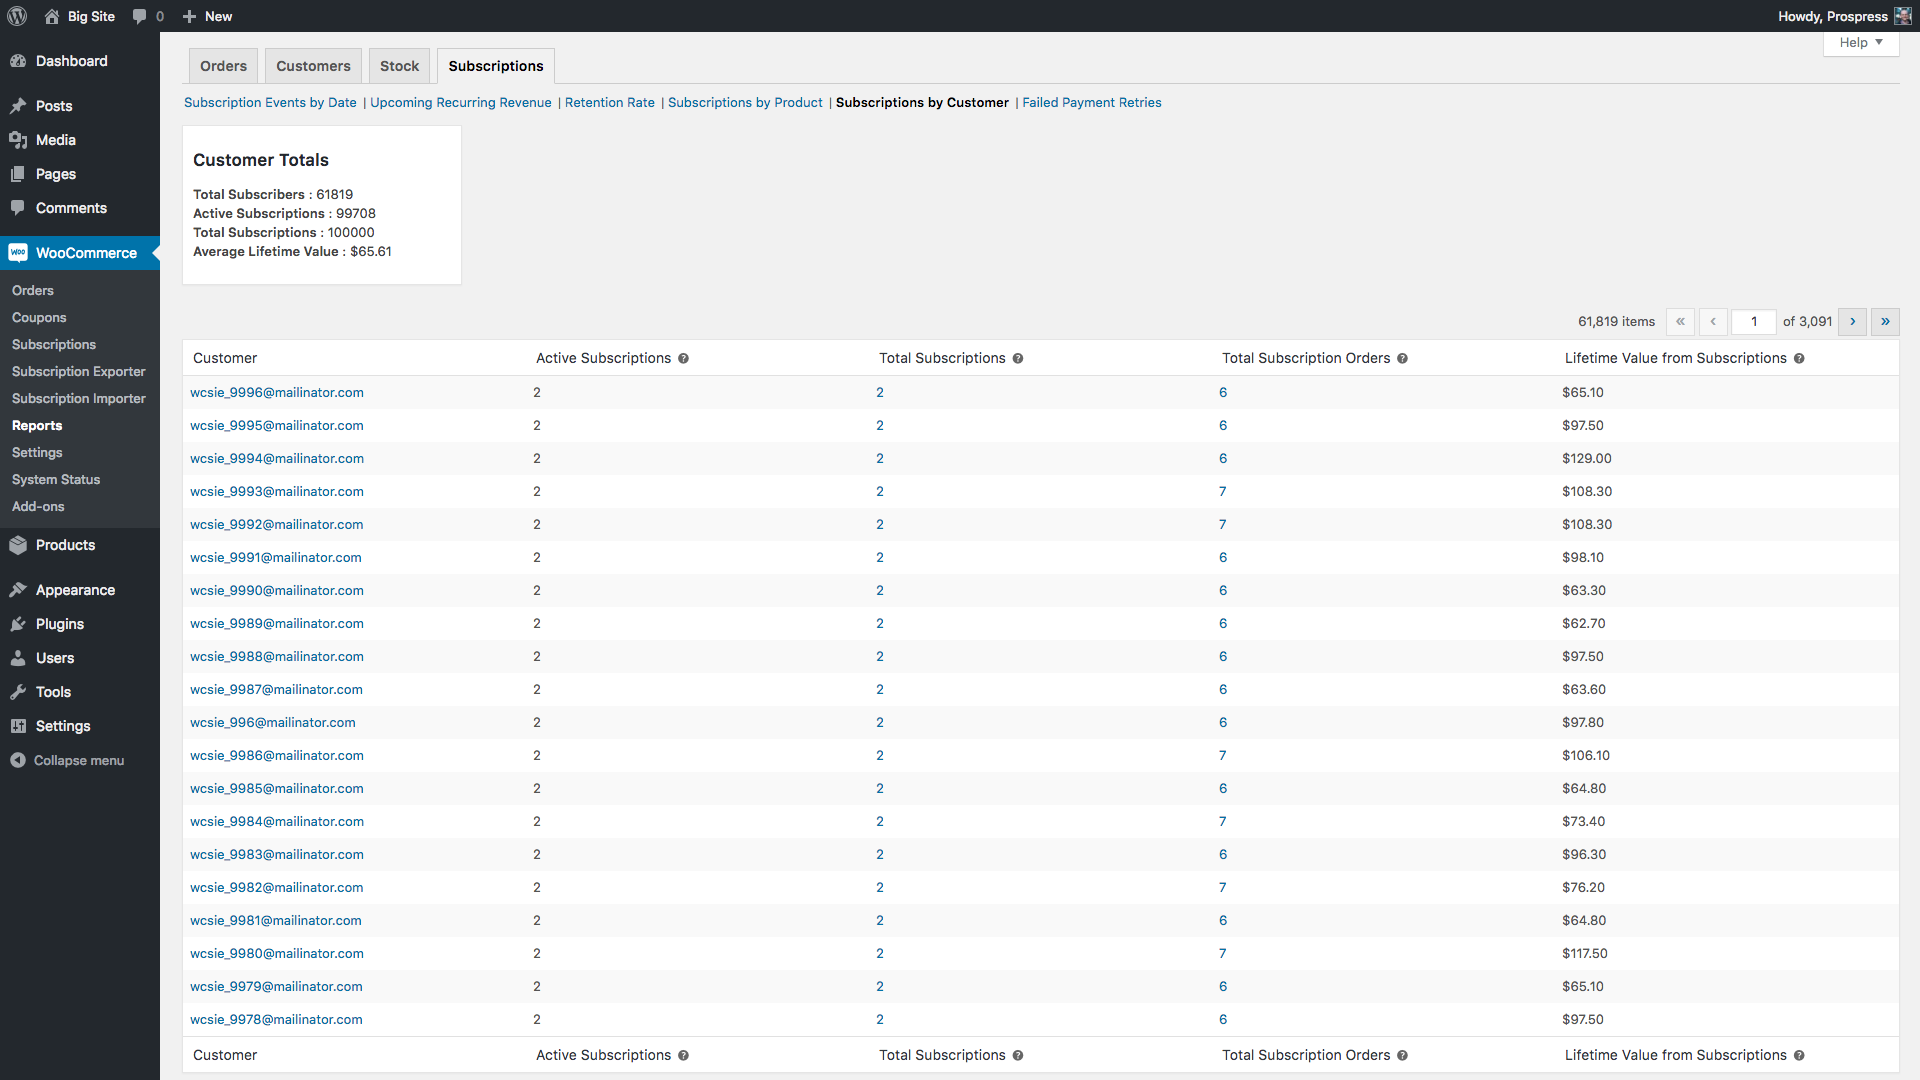
Subscriptions by Customer Report
↑ Back to topThe Subscriptions by Customer report provides an overview of your most loyal and valuable customers.
This report provides a breakdown of:
- Active Subscriptions: Number of subscriptions this customer has with a status of active or pending cancellation.
- Total Subscriptions: Number of subscriptions this customer has with a status other than pending or trashed.
- Total Subscription Orders: Number of signup, switch and renewal orders this customer placed at your store with a paid status (i.e. processing or complete).
- Average Lifetime Value: Total value of this customer’s signup, switch and renewal orders. This includes fees, tax and shipping line items on those orders.
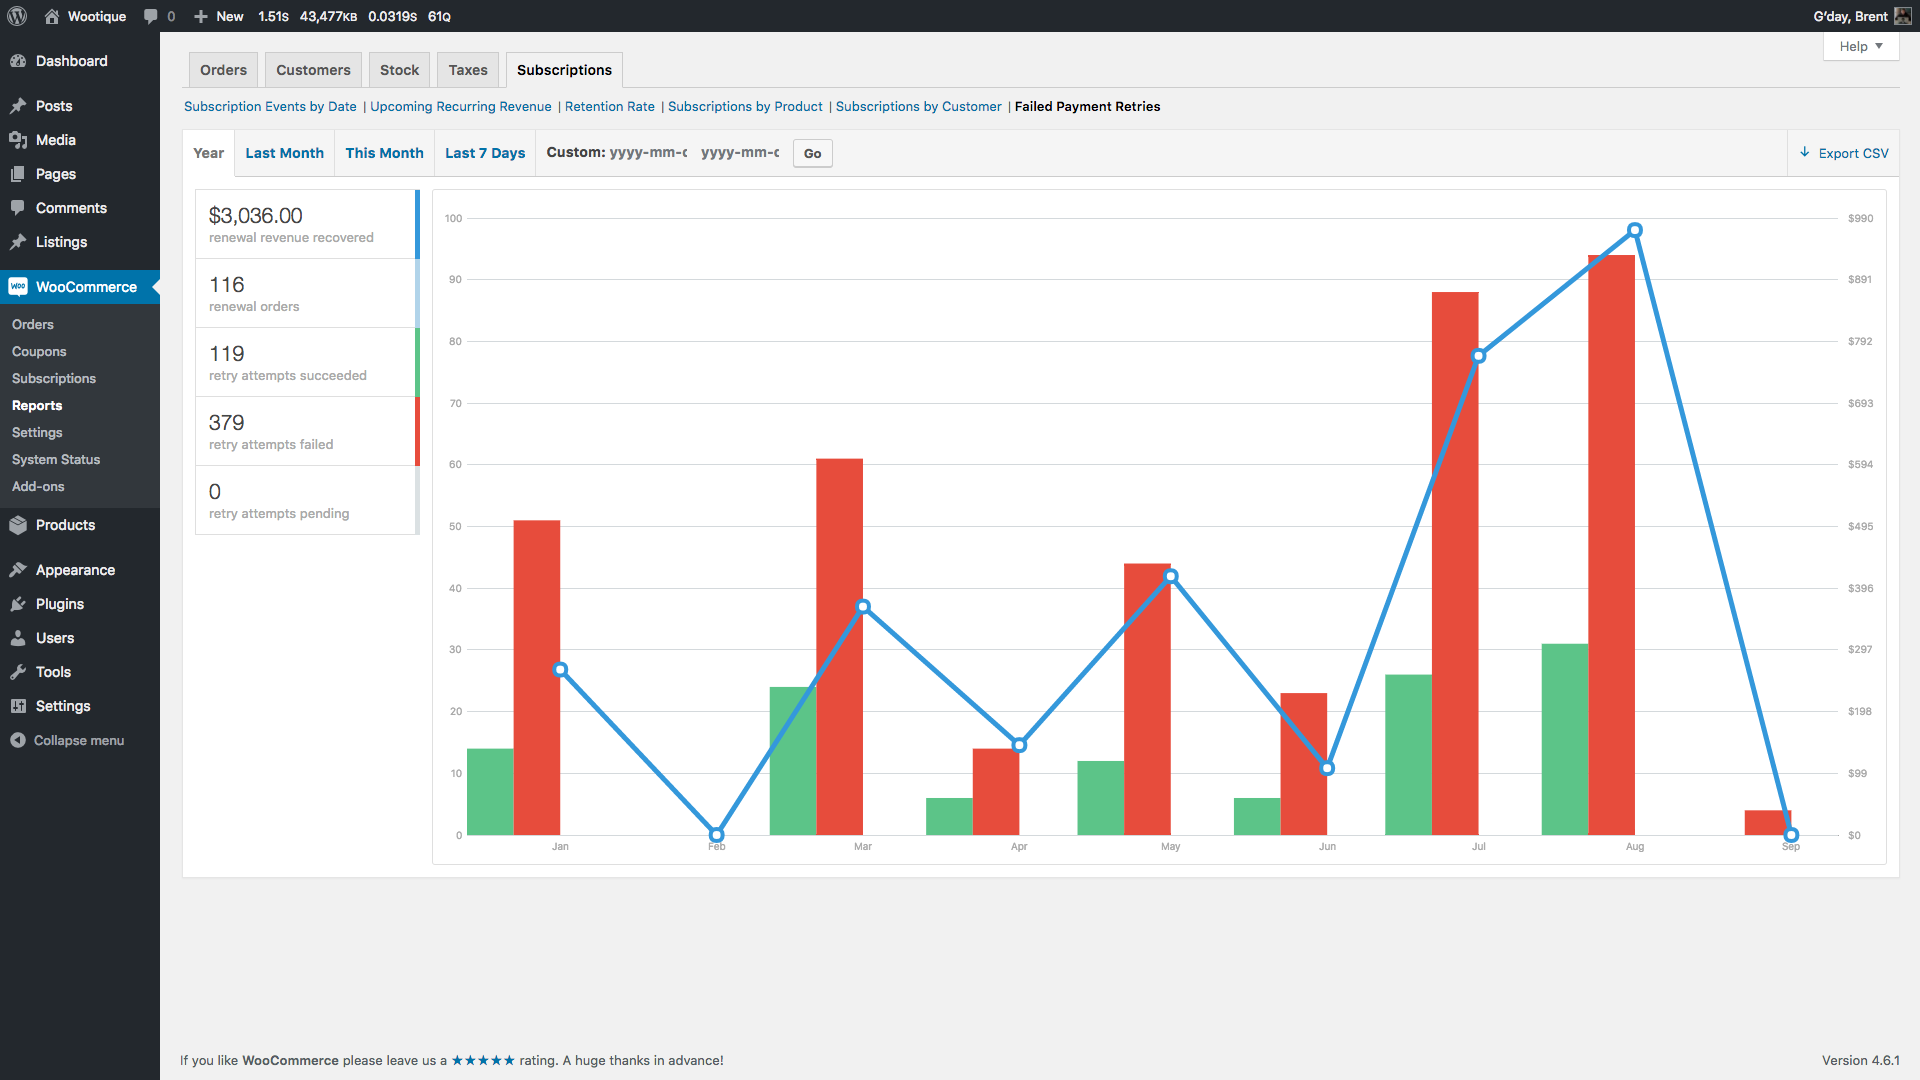
Failed Payment Retries Report
↑ Back to topThe Failed Payment Retries report provides an overview of the attempts to automatically retry recurring payments that previously failed via the Subscriptions’ Retry System.
This report details:
- Recovered Renewal Revenue: Total revenue, including tax and shipping, recovered with the failed payment retry system by successfully processing payment on a renewal order that previously failed.
- Renewal Orders: Number of renewal orders with a failed payment and then managed by the retry system to attempt to recover revenue for this order.
- Successful Retry Attempts: Number of retry attempts to process a payment that previously failed.
- Failed Retry Attempts: Number of retry attempts for this period that did not result in successful payment. Default retry rules include 5 retry attempts for each failed payment, so it is common for this number to be larger than the number of renewal orders and successful retry attempts.
- Pending Retry Attempts: Number of retry attempts not yet processed. For any pending retries to be displayed in this report, you need to choose a custom date range and include a date in the future as pending retries are only ever in the future.
WooCommerce Status Widget
↑ Back to topIn addition to data on the WooCommerce > Reports administration screens, Subscriptions also adds data about subscription related events to the WooCommerce Status widget on the main WordPress Dashboard.
Data in this widget includes the following for current calendar month:
- Signup count: New subscriptions purchased by customers placing an order in the store.
- Renewal count: Number of manual and automatic renewal orders created and currently with the status of completed, processing, on-hold or refunded.

FAQ
↑ Back to topHow is report data cached?
↑ Back to topReport data is cached to speed up the load time of the Reports. Report data is cached in the background to avoid slowing down page load times for your customers or other administrators. These requests are initiated via WordPress’s Cron system. When and exactly how the report data is cached depends on the size of your site’s database.
On small sites with less than 3,000 subscriptions and 25,000 orders, the process to update the cache for report data is scheduled to be 5 minutes after any event that would invalidate the existing cache. The update process for each report is then separated 5 minutes to avoid running the resource intensive queries on your site’s database at the same time. This means the cache of report data may fall out-of-sync by up to 30 minutes with the site’s current data.
On sites with more than 3,000 subscriptions or 25,000 orders, the cache is only updated once per day. This update begins at 4am in your site’s timezone. The cache update process for each report is separated 15 minutes to avoid running all the resource intensive queries on your site’s database, which can potentially lead to the database being inaccessible via other requests. This means report data may be as much as 24 hours out-of-date on larger sites.
If your site is using the later method, a notice indicating this will be displayed at the top of the Report page.

How can I disable report cache updates?
↑ Back to topOn larger sites with over a hundred thousand rows in the posts table, which generally means over 100,000 orders, subscriptions or other WordPress post types, like blog posts or pages, the report queries may lead to MySQL errors, often seen by 502 Bad Gateway HTTP errors.
To avoid these errors without having to fine tune MySQL, you can disable report cache updates using the free plugin here. This prevents the queries running automatically in the background to update the report data. The database queries will still run when loading the Reports page to generate the data.
These queries will be rewritten once WooCommerce and Subscriptions move to custom database tables to avoid having issues until having much larger databases.
What is a “cache invalidating” event?
↑ Back to topCache updates are only run after a cache invalidating event. These are events which add, remove or modify some piece of data that is included in a report.
The events which invalidate the cache vary depending on the report. Example events are a new renewal payment, subscription status change or subscription upgrade/downgrade.
Why do reports on custom time periods load more slowly than default time periods?
↑ Back to topWhen loading reports for pre-defined time periods, like Last Month, cached data is used. However, when loading reports for customer time periods, like 18th January to 13th November, the report data must be generated. It is not feasible to cache report data for all possible time periods. This means viewing a report for a custom time period will often be slower than viewing a report for a pre-defined period.
How do I get more advanced reporting?
↑ Back to topTo get access to additional reports or more fine grained control over reports, there are two options:
- Use Metorik reports for Woo Subscriptions. Connecting your store to Metorik provides reports for historical data, not just events which occur after connecting to Metorik.
- Request the new reports or modifications to existing reports via the Woo Subscriptions Ideas Board. Features that get over 200 votes are added to the roadmap.